Welcome to GIMI Web
A user-friendly web app to coordinate coexistence in maize agronomic regions
Using simple analysis based on experimental data, this tool qualitatively describes the influence of genetic modified maize fields on the surrounding conventional ones.
- Introduction
- Registration
- Background Image
- Create your fields on a canvas
- GIMI Web home page: input sections
- GIMI Web home page: output sections
- Save button, Upload and Download files
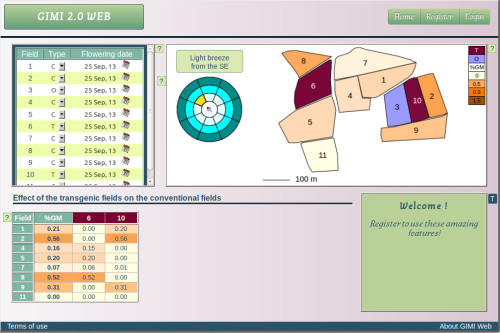
1. Introduction
This tutorial gives the basic instructions to GIMI Web users. Clicking the "Skip tutorial and start using GIMI" message at the bottom of the page will close this window.
In most pages in GIMI Web, you can:
- click on the small blue square with a T to reopen the tutorial.
- click on the small boxes with a question mark inside. They contain useful information about the current page.
- change the language. Currently, it supports Catalan, Spanish and English.
2. Registration
Registration is a very simple step that will give you access to all features of the GIMI Web. For example, you will be able to create your own fields, save your configuration for future analysis, etc.
And more important, it is free!

Go to the registration page by clicking the Sign In button on the navigation menu.
Enter your username, password and email and click Sign Up.
The navigation menu will get different, it has more options!

3. Background Image
You can enter the coordinates of your fields by drawing it on a canvas.
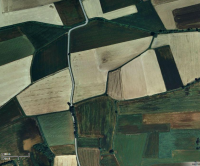
GIMI allows you to set a background image of the fields of interest, as the one on this screen, or a land registry image.
In the navigation bar, go to the Background Image page. There, you can select an image from your computer by clicking the Choose File button. Once the image has been selected, it can be uploaded to the server by clicking the submit button.
The selected image will appear on the screen after a few seconds (uploading large images may take longer time).
Now, you can go to the Create Fields page and start drawing your fields.
4. Create your fields on a canvas.
The page Create Fields allows you to draw any set of fields in a canvas.
If you selected an image to use as a background, you will see it on the canvas (anytime you can go back to a blank canvas by clicking the Blank Background button at the bottom of the screen).
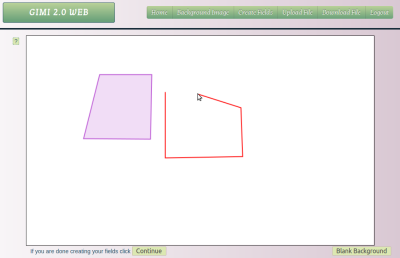
Create your fields one by one, by drawing closed polygons on the canvas. To draw a polygon, you must click on their vertices in order. Clicking very close to the first vertex will close the field (find more information by clicking the question mark).
You will have to introduce the scale of your fields by drawing a segment and entering the corresponding length at the bottom of the page.
Click the Finish when you are done, and GIMI Web will redirect you to the GIMI Web Home page.
5. GIMI Web home page: input sections
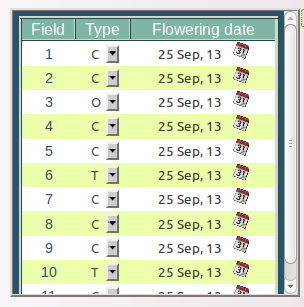
There are two different input sections on the Home page: the Field Properties table and the Wind Wheel.
Field properties table: it lists all fields and records its properties. The first column indicates the number of the field, the second one shows the type of field, and the third one the flowering date.
Types of field: transgenic (T), conventional (C) or other (non-maize) (O)
Flowering date: it is defined as the date in which 50% of the plants in a field do have flowers.
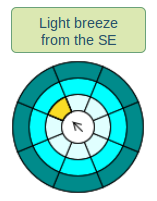
Wind wheel: it is an interactive tool that allows choosing the intensity and direction of the main wind. Just click on it!
Note: please enter the average wind occurring during the flowering period. More precisely, the wind fo interest corresponds to the average wind during the daily hours in which the pollen disperses from the anthers.
6. GIMI Web home page: output sections
There are two different output sections on the Home page: the Canvas and the Field to Field table.
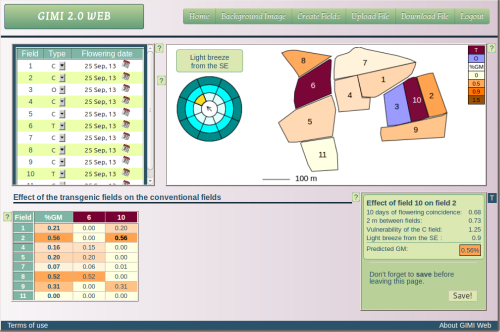
Canvas (top right of the screen): the fields are plotted on the canvas. They have different colors in accordance to the type of field and the estimated GMO contents. Click on each field to get information on its area and perimeter.
Field to Field table (bottom left): this table shows the estimated total amount of GMO in the conventional fields, and a detailed description of the specific contribution by each transgenic field. The color of the cells depends on the amount of GM, following the same color scale as in the Canvas.
Click any table cell to get more information on the interaction between the two selected fields (transgenic and conventional).
If you are using the GIMI Web for the first, you will find some example fields on the Home page. Try to change the flowering date, the type of the fields, and the wind conditions. You will see the effects on the Canvas and on the Field to Field table!
7. Save button, Upload and Download files
The Upload File and the Download File are very useful tools that are on the navigation menu.
The Upload File page allows uploading a previously created file that contains the information of a group of fields, so that you don't have to re-start drawing it on the Canvas.
The Download File link allows downloading a file with the information of a group of fields: it can be very easily imported into an excel sheet. Note that the configuration of the fields in the downloaded file will be the one that has been previously saved on the server.
In the Home page, use the Save button at the bottom right of the screen to save the configuration of your fields on the server. This way, anytime you log in the GIMI Web they will show on the Home page.
This is all you need to know to start working with GIMI!
Remember that you can open this tutorial anytime by clicking on the small blue box with a T.